An infographic report can be created, edited, and viewed only by Administrators. In this guide, we review how to create an infographic report.
Step 1: Creating a report
- To create an infographic report:
Go to Home -> Reports (1) -> Infographics (2) and click Create (3).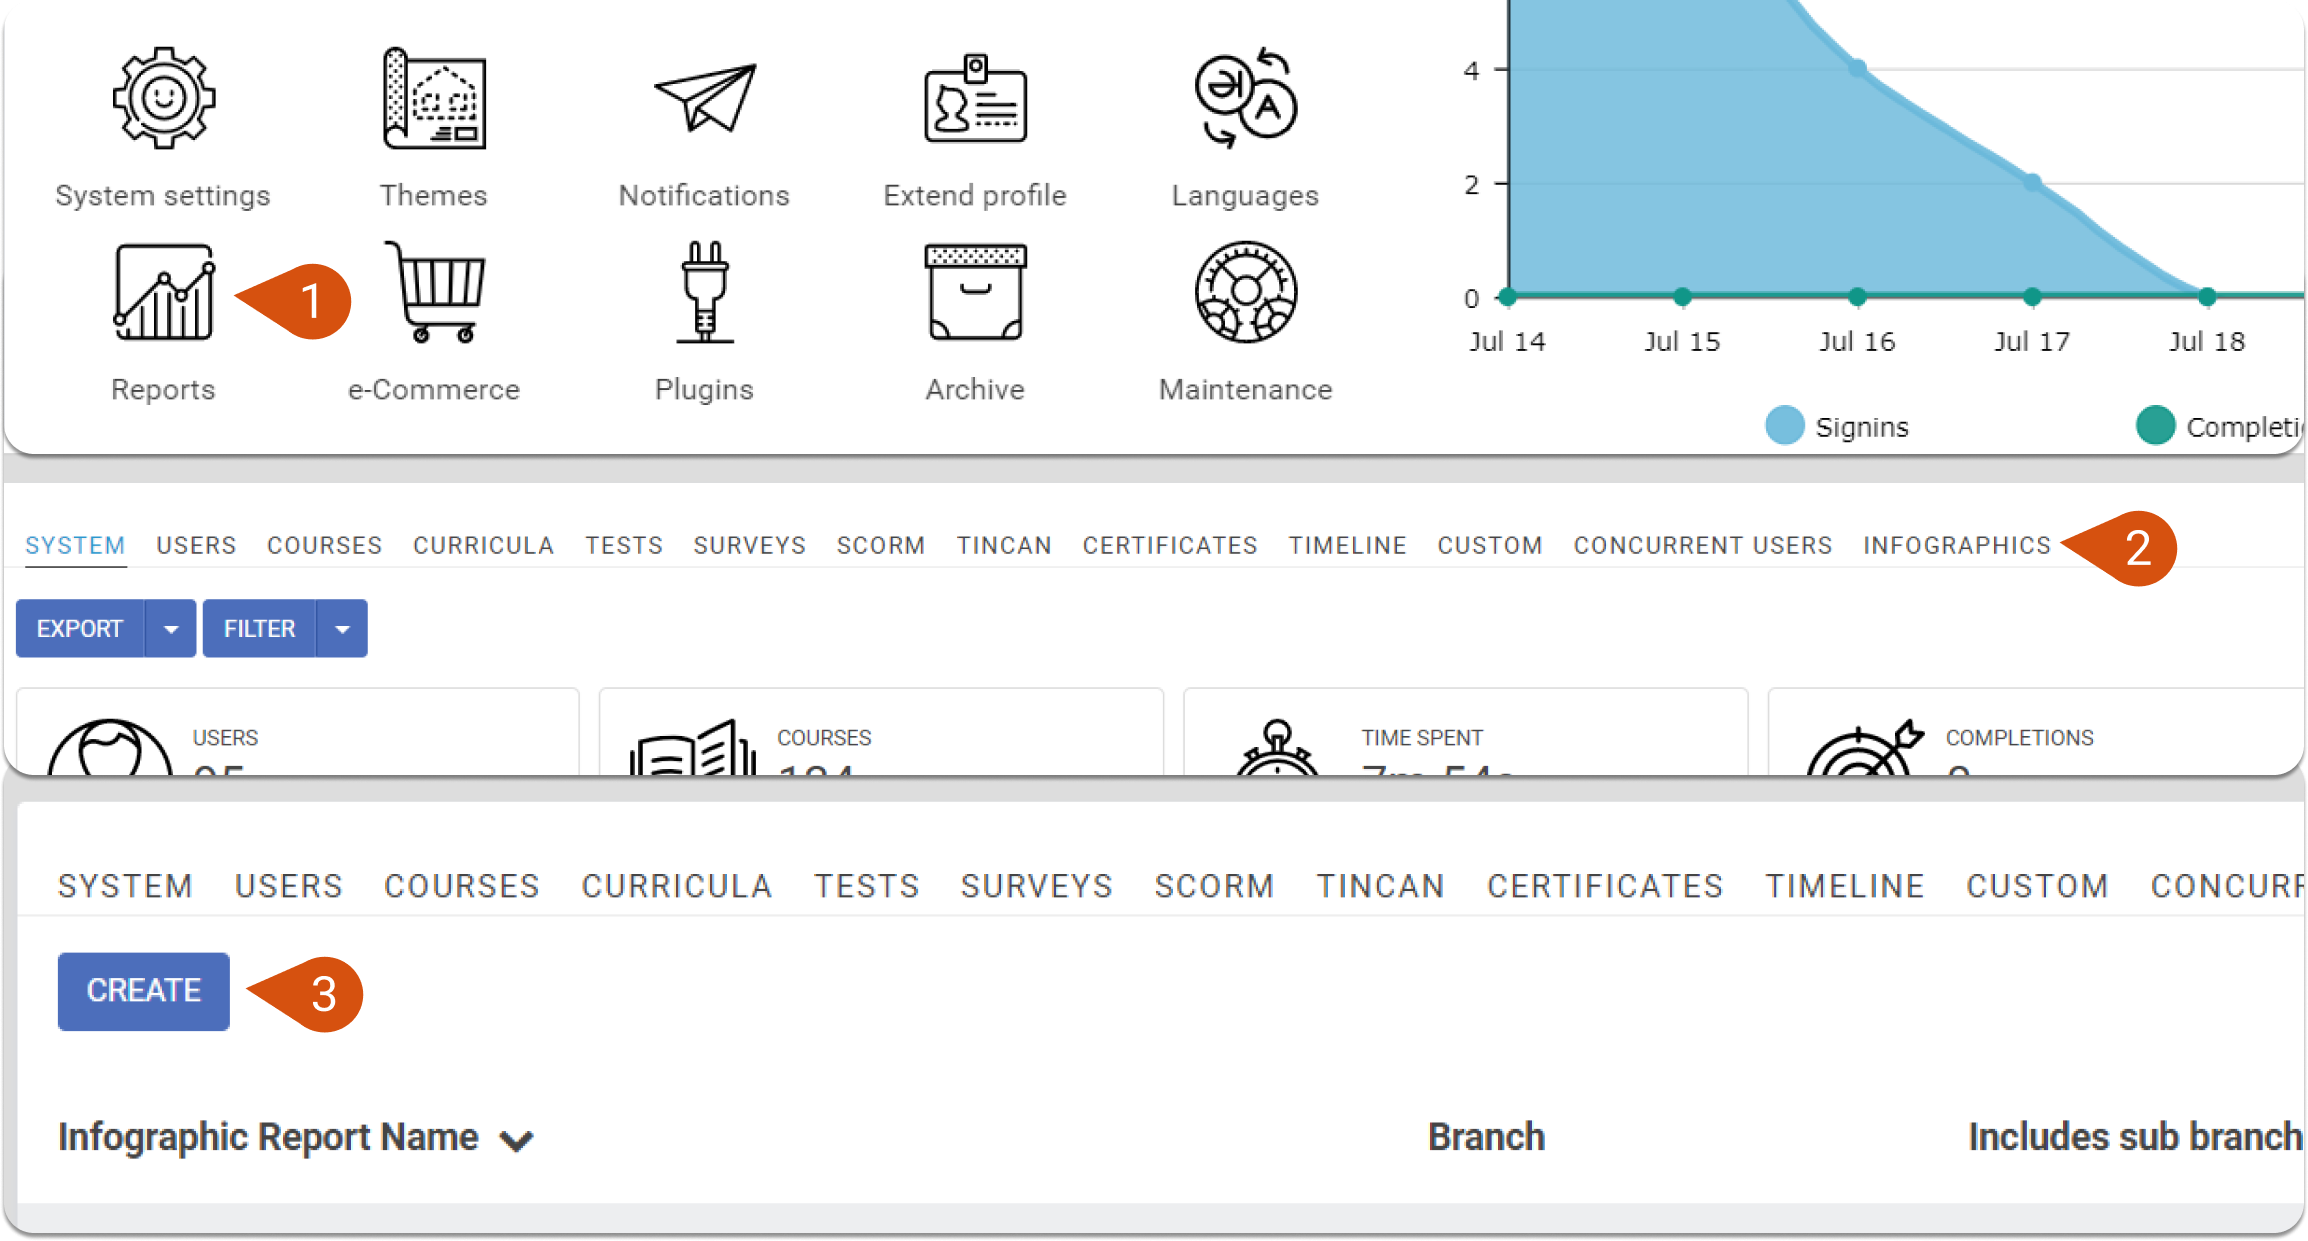
- Type in the report’s name and select if that report will be tied to a specific branch. If you select a branch, then you can choose whether the branch report will include the sub-branches, or if it will only display data for the selected branch.
After creating the report, proceed with adding sections to it.
Step 2: Adding sections
While in the Edit (1) view, select Add section (2).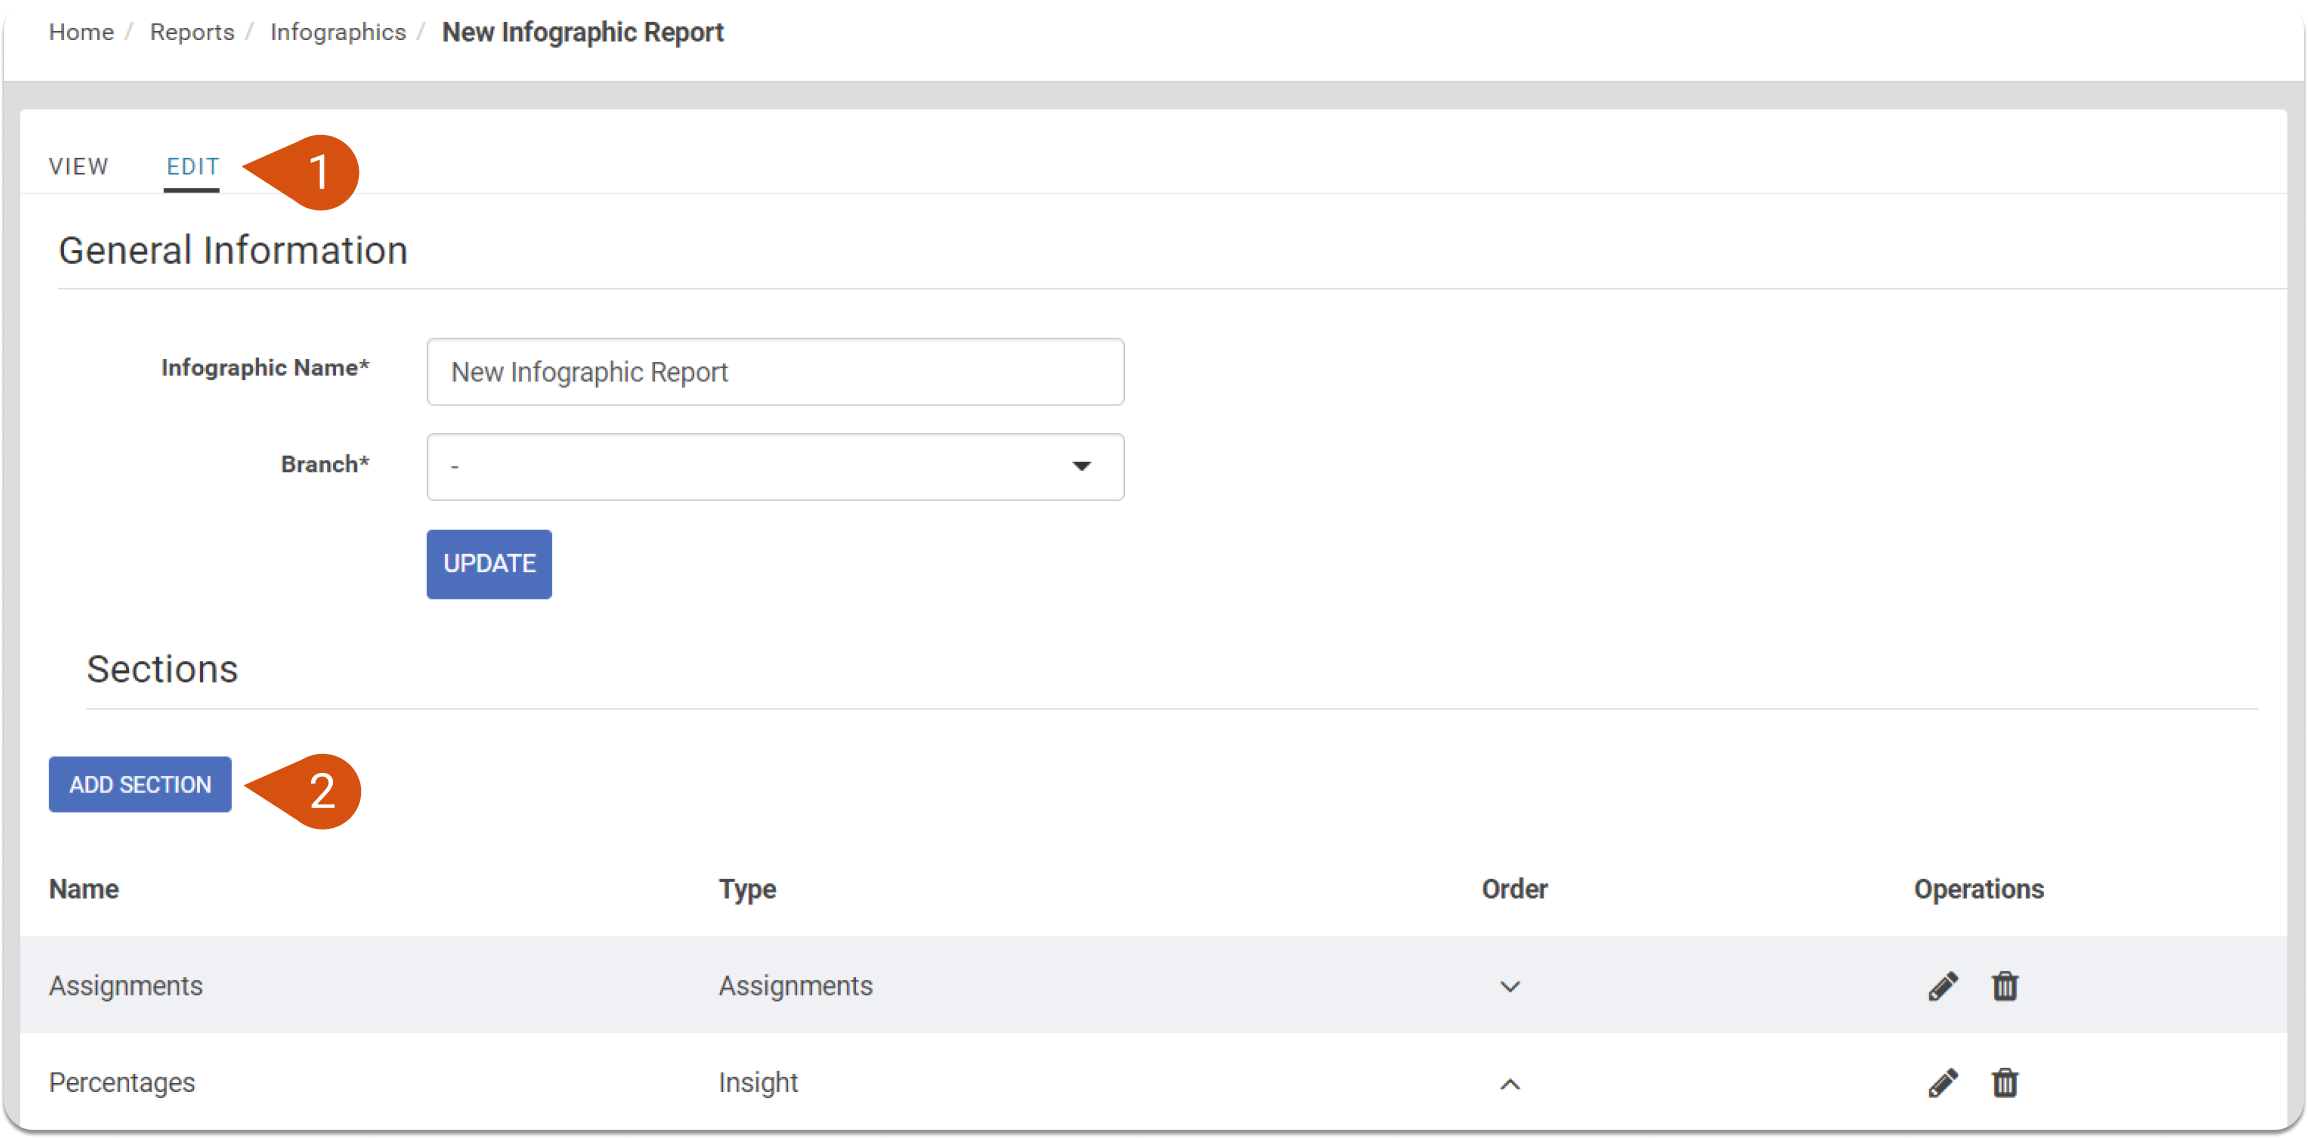
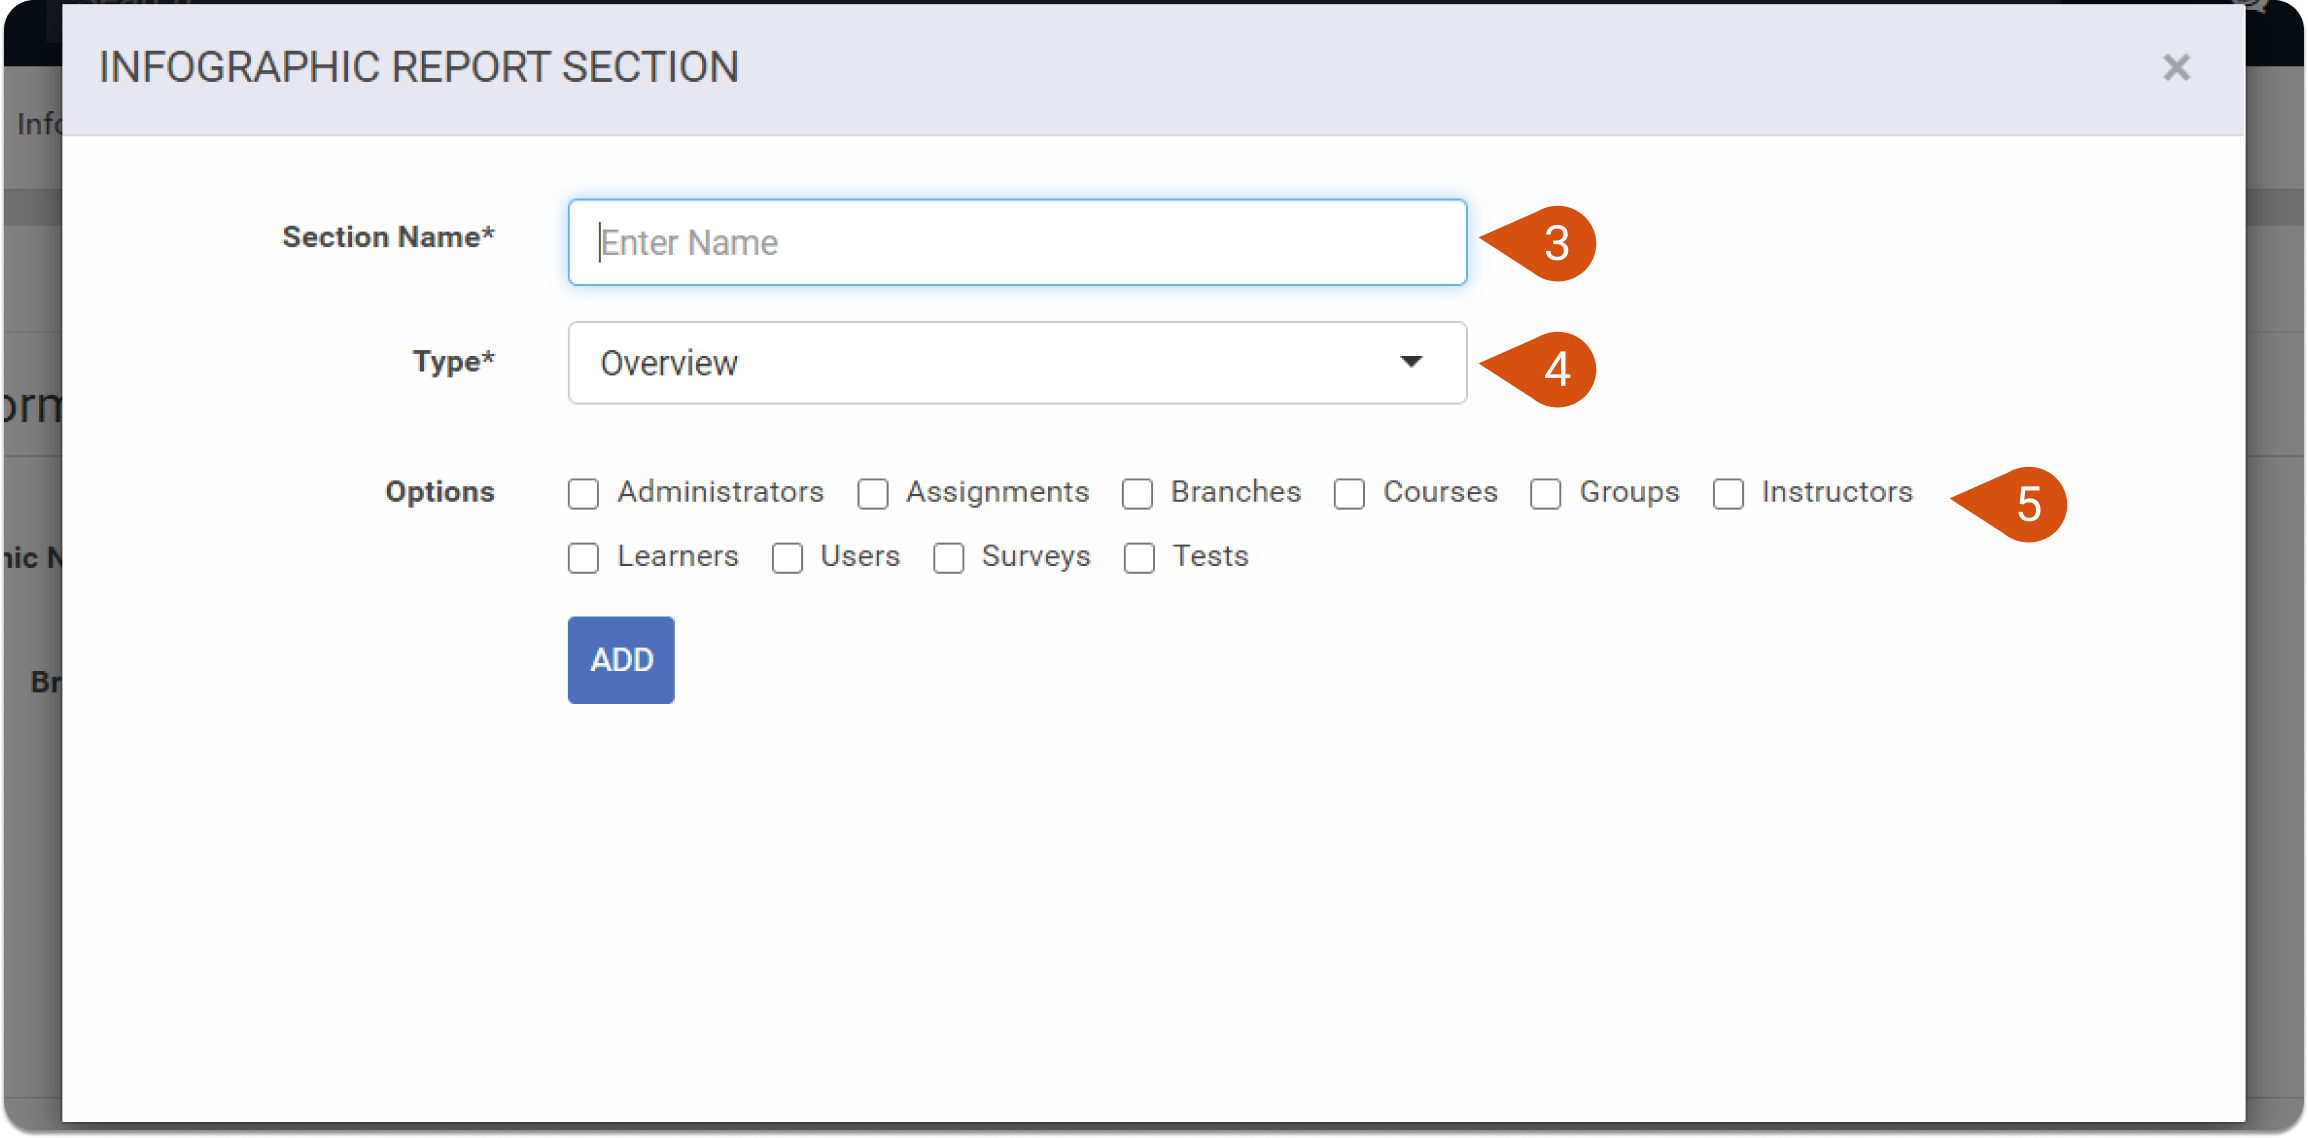
A pop-up appears, where you can set the:
- Section Name (3).
- Section’s Type (4).
- Section’s Options (5).
There are currently 8 available section types.
| Note: You can select up to 5 options in sections with multiple options. |
Step 3: Viewing a report
The View tab displays all the sections of a report. Each section consists of the section’s name, and that section’s options.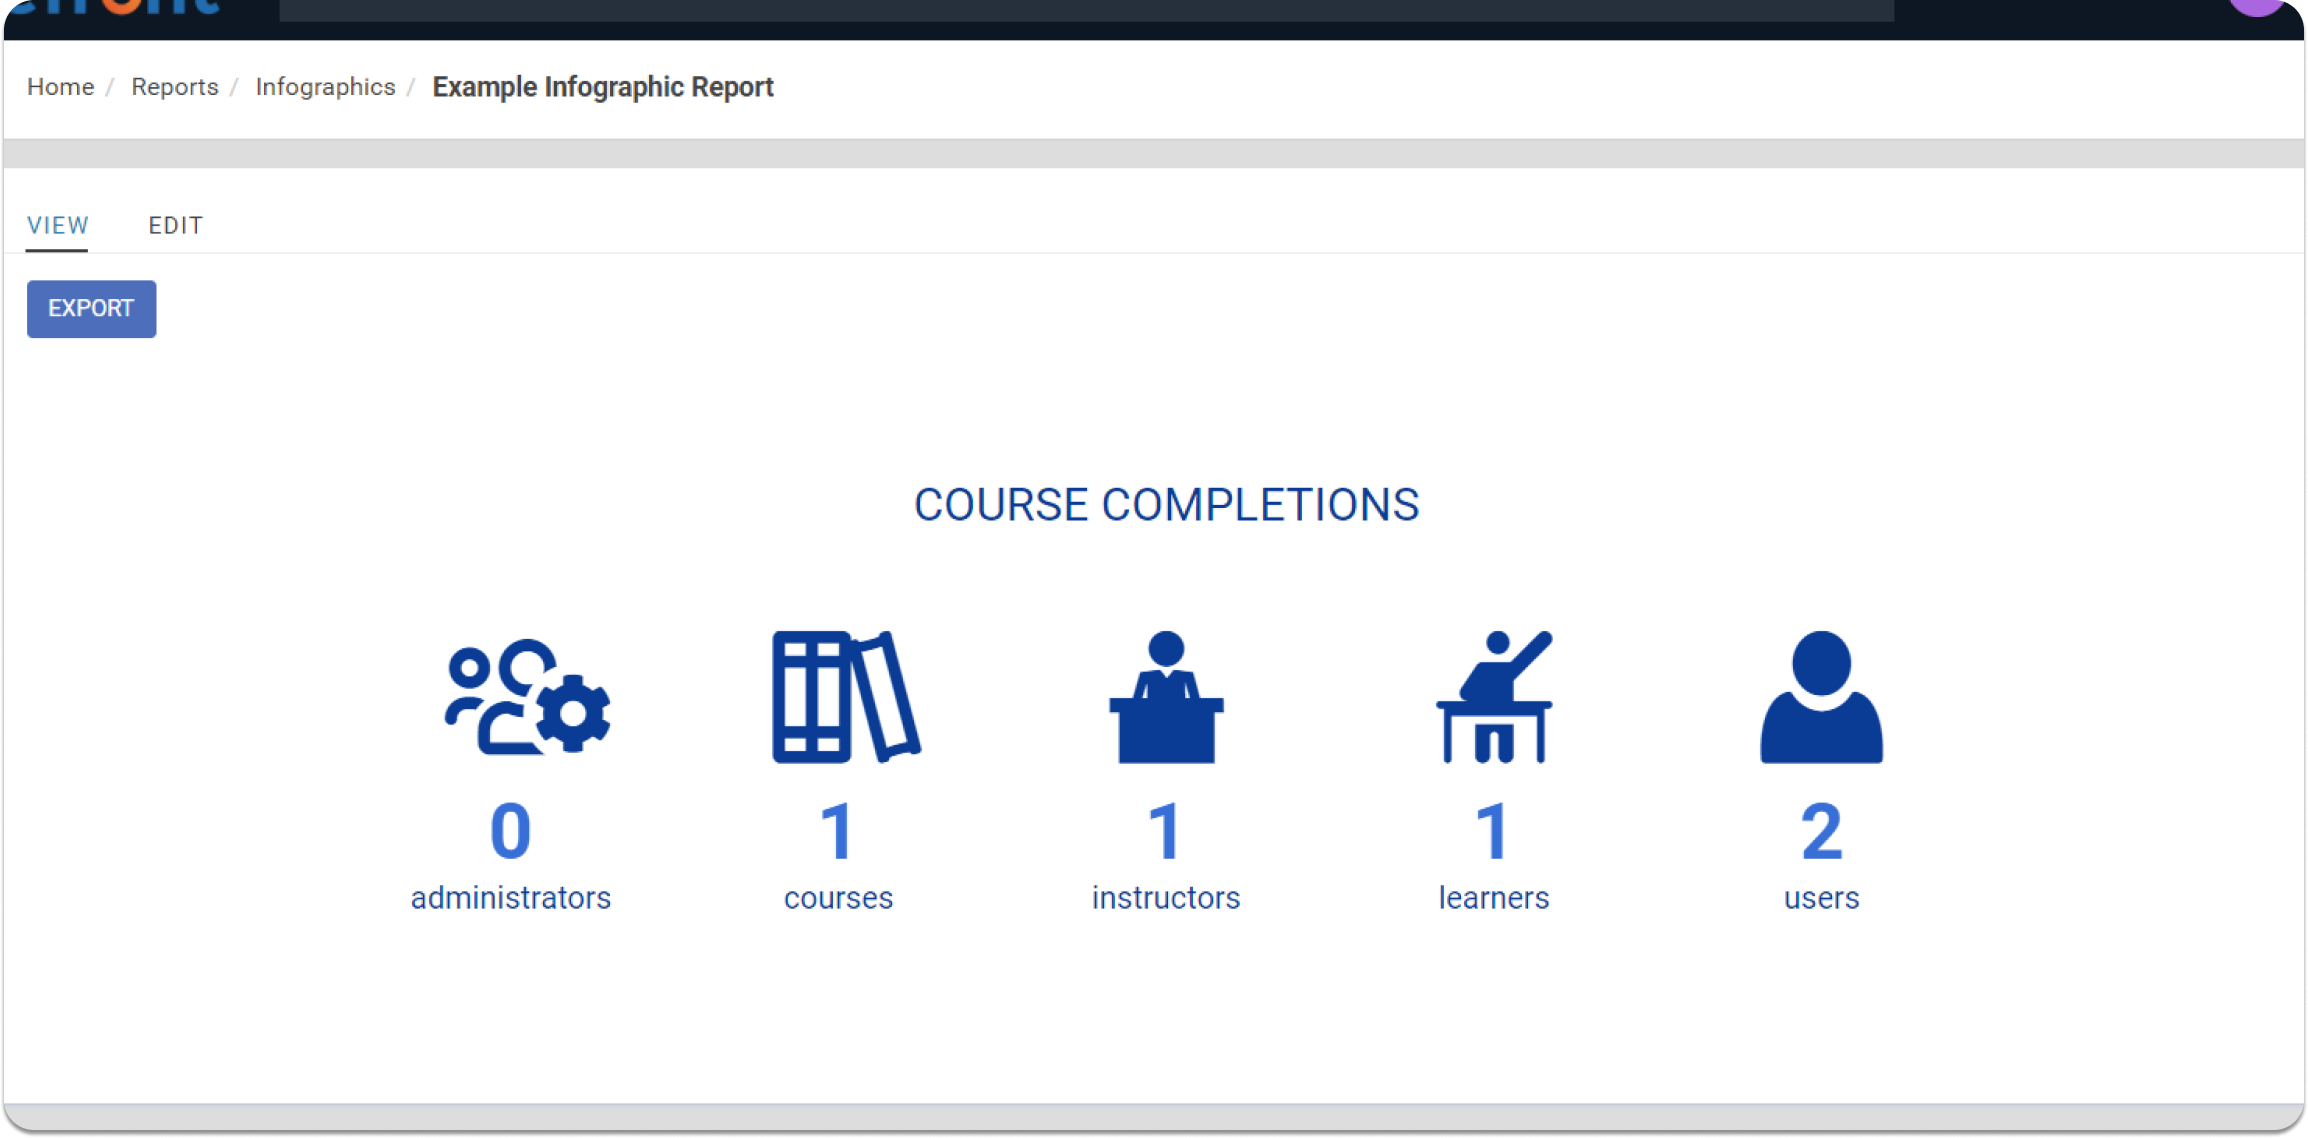
Step 4: Exporting a report
You can export the infographic report in the form of an image using the Export button (1), displayed on a report’s main view page.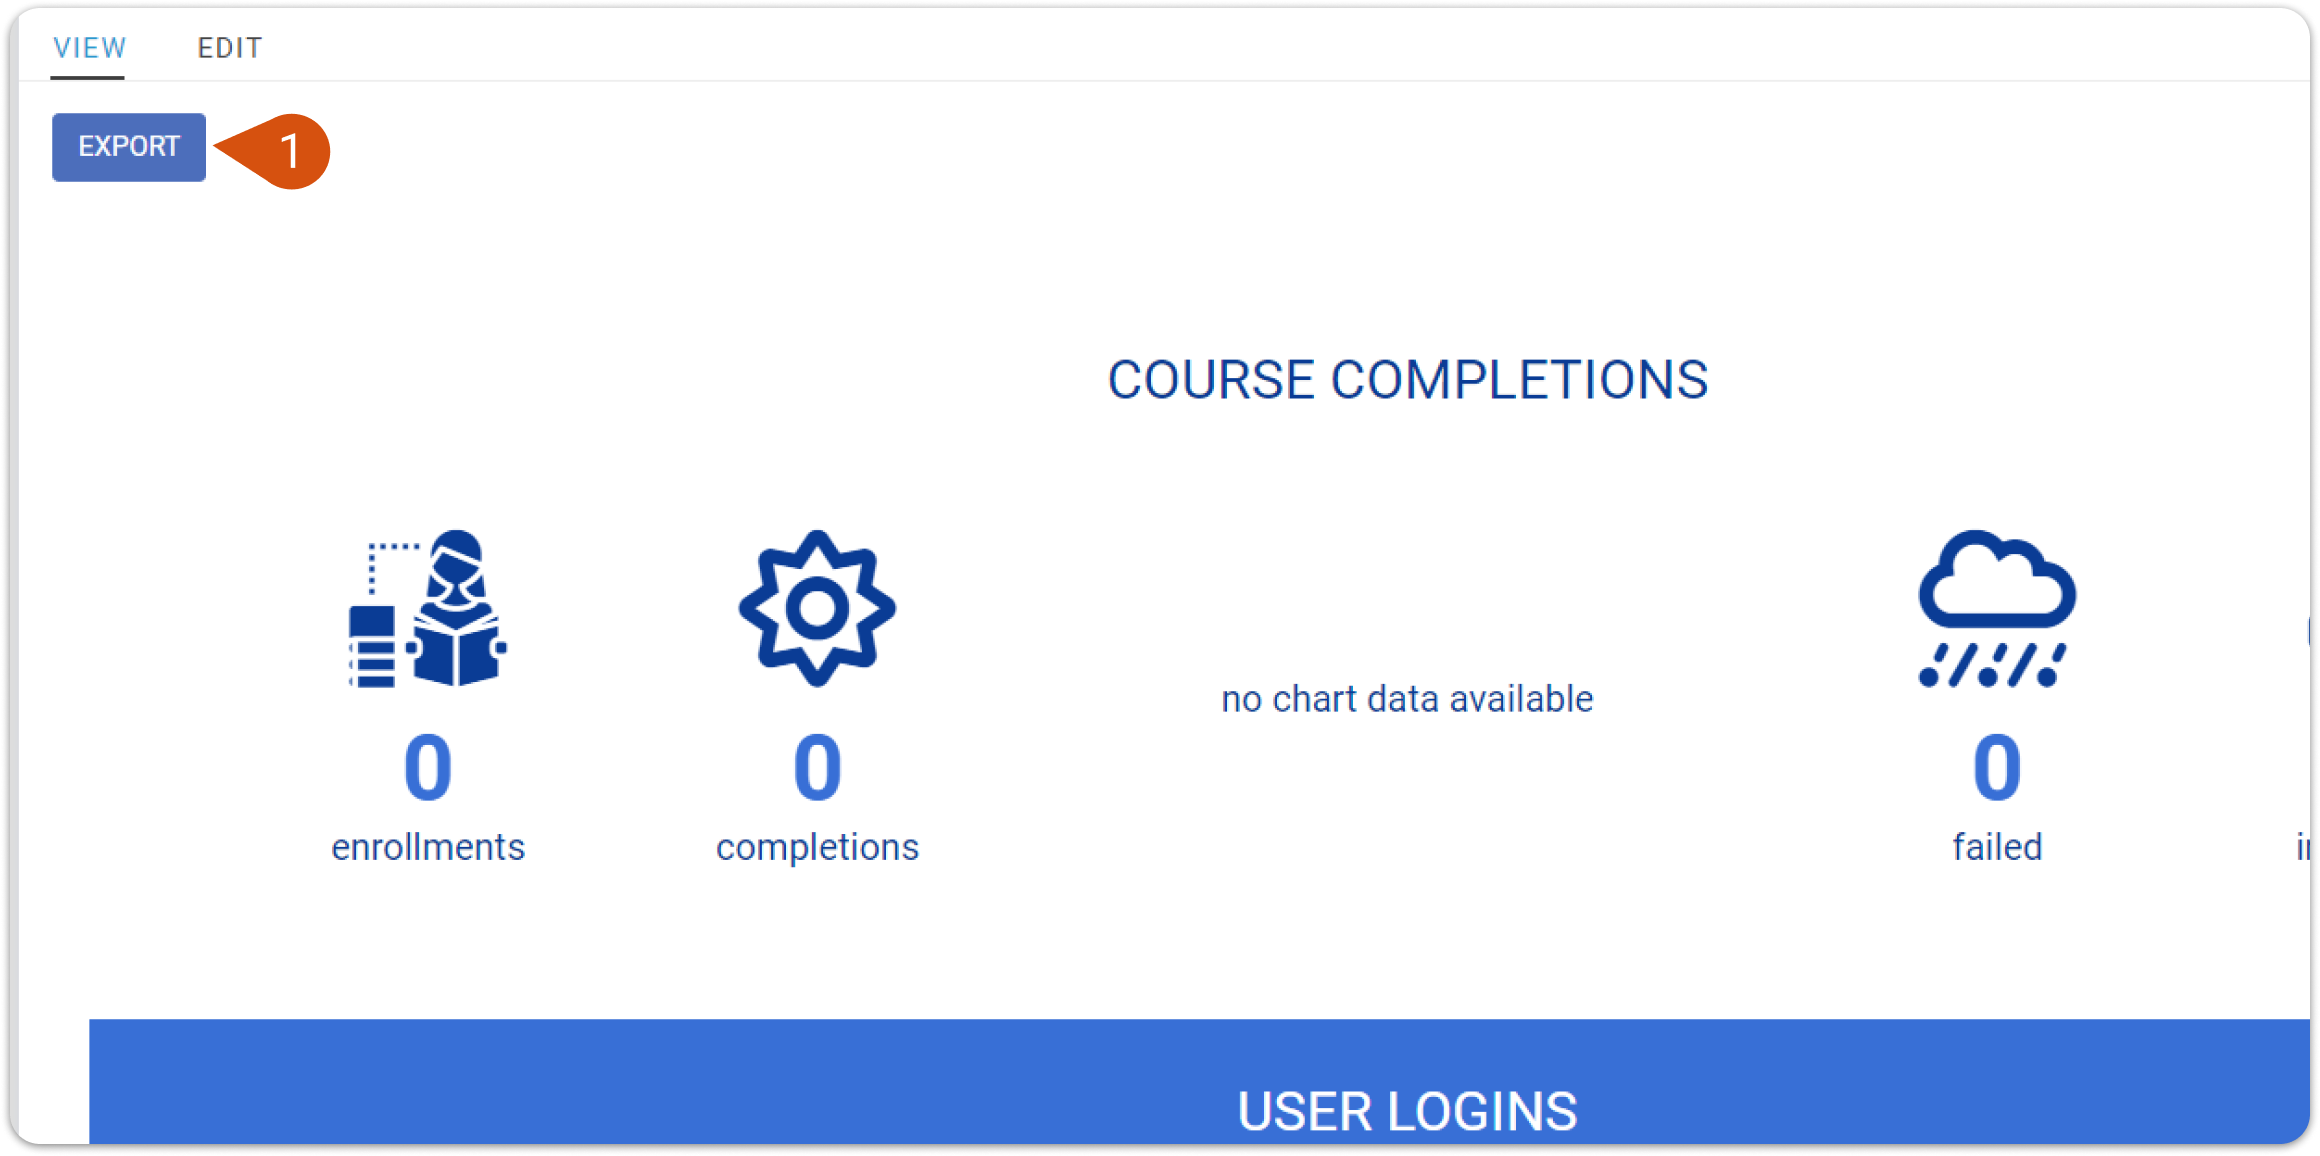
Each section type allows different available options (or data items). Sections cannot have more than 5 enabled options.