An infographic report is structured by Sections. There are 8 different section types available.
Overview
This section type displays total numbers for:
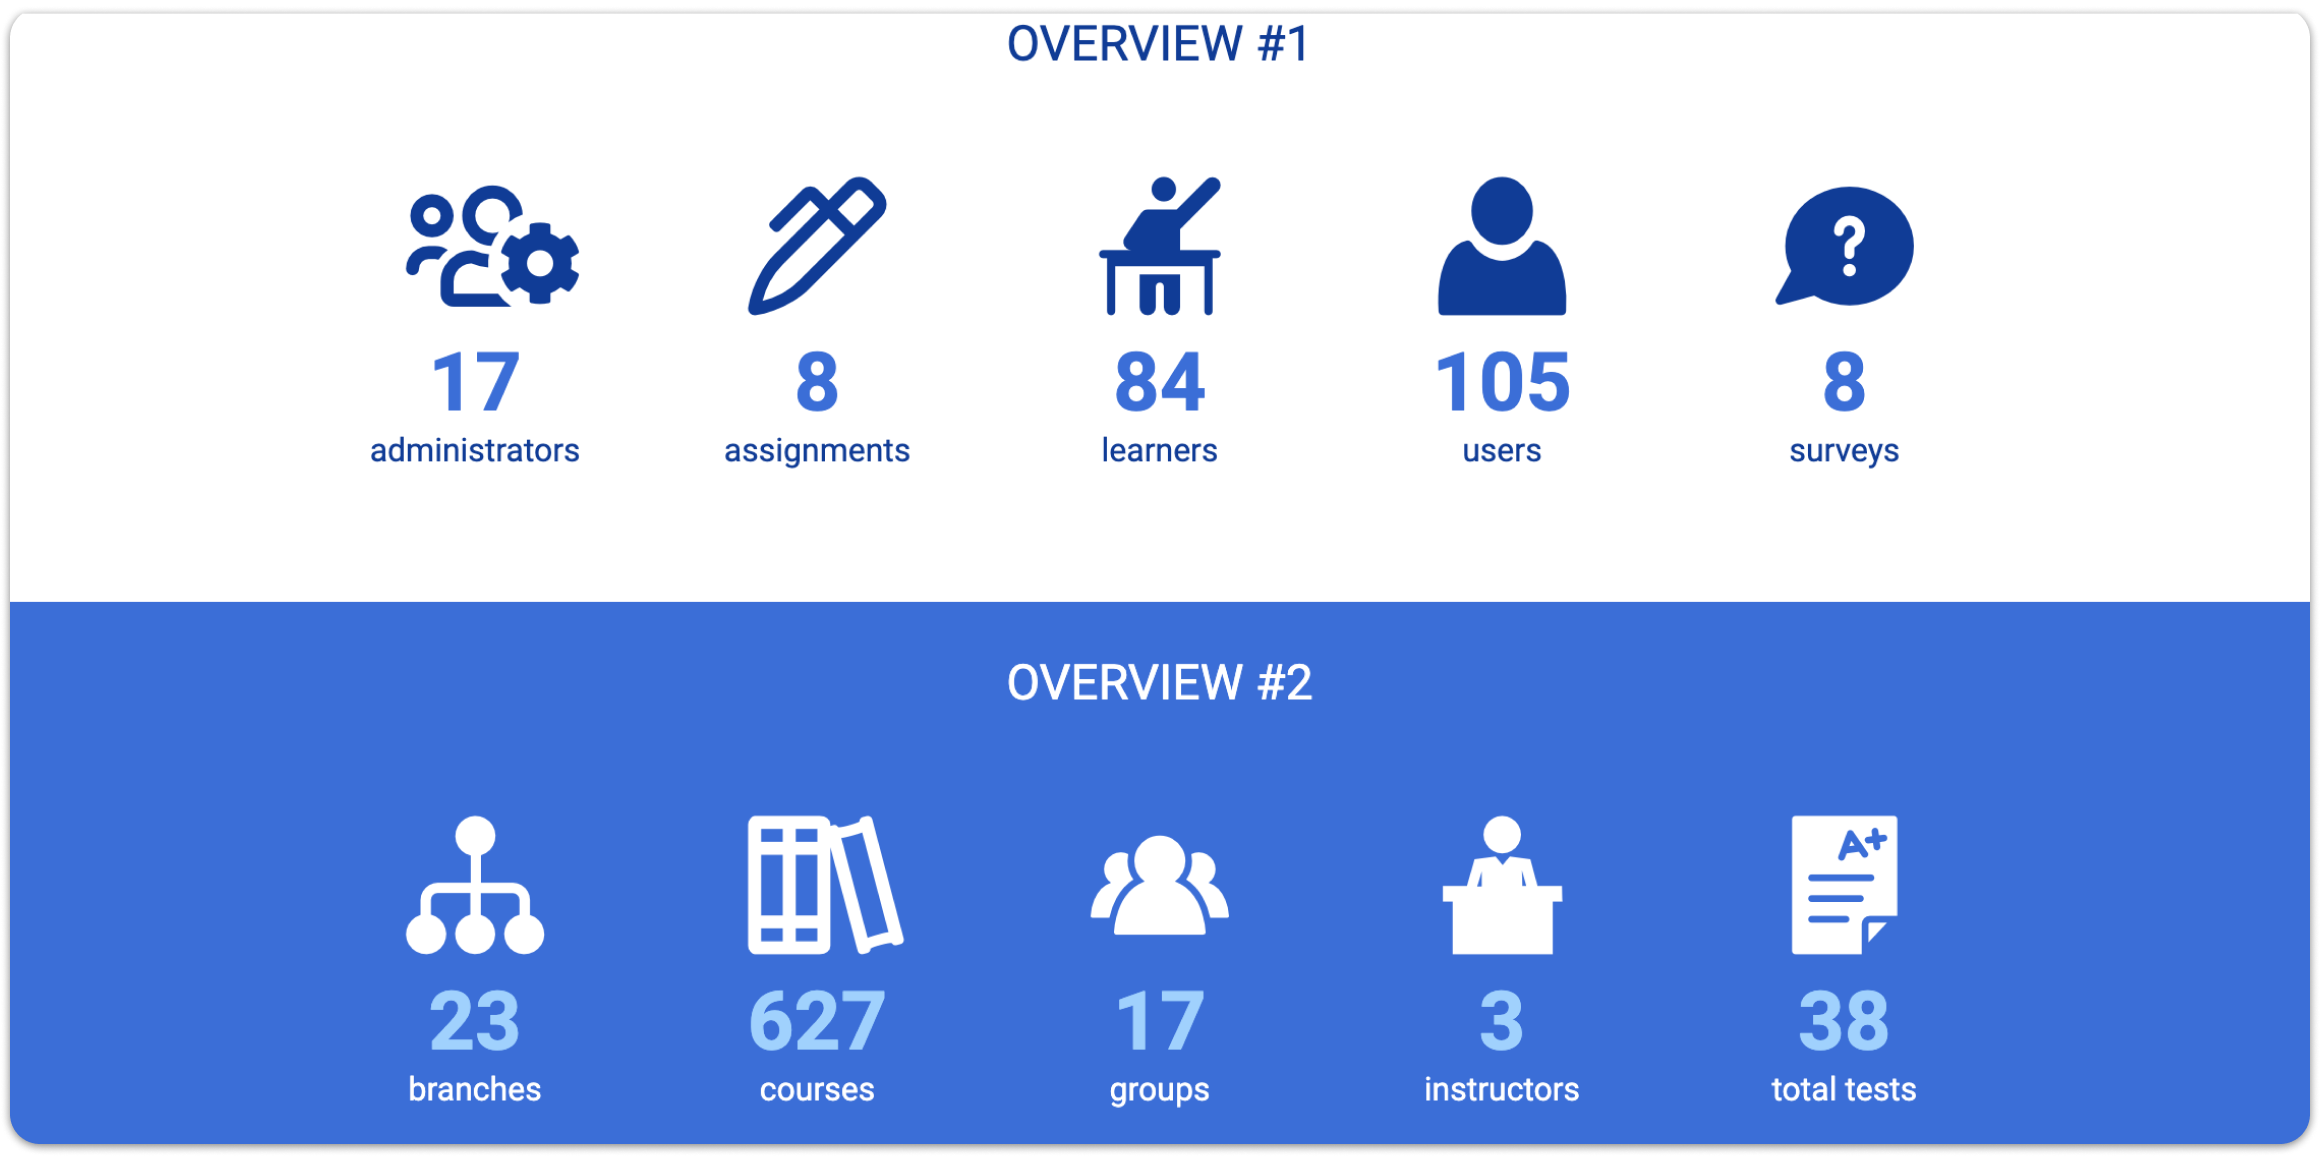
- Administrators
- Assignments
- Learners
- Users
- Surveys
- Branches
- Courses
- Groups
- Instructors
- Tests (includes all test modes: Normal, Self-assessment, Knowledge parity assessment)
Insights
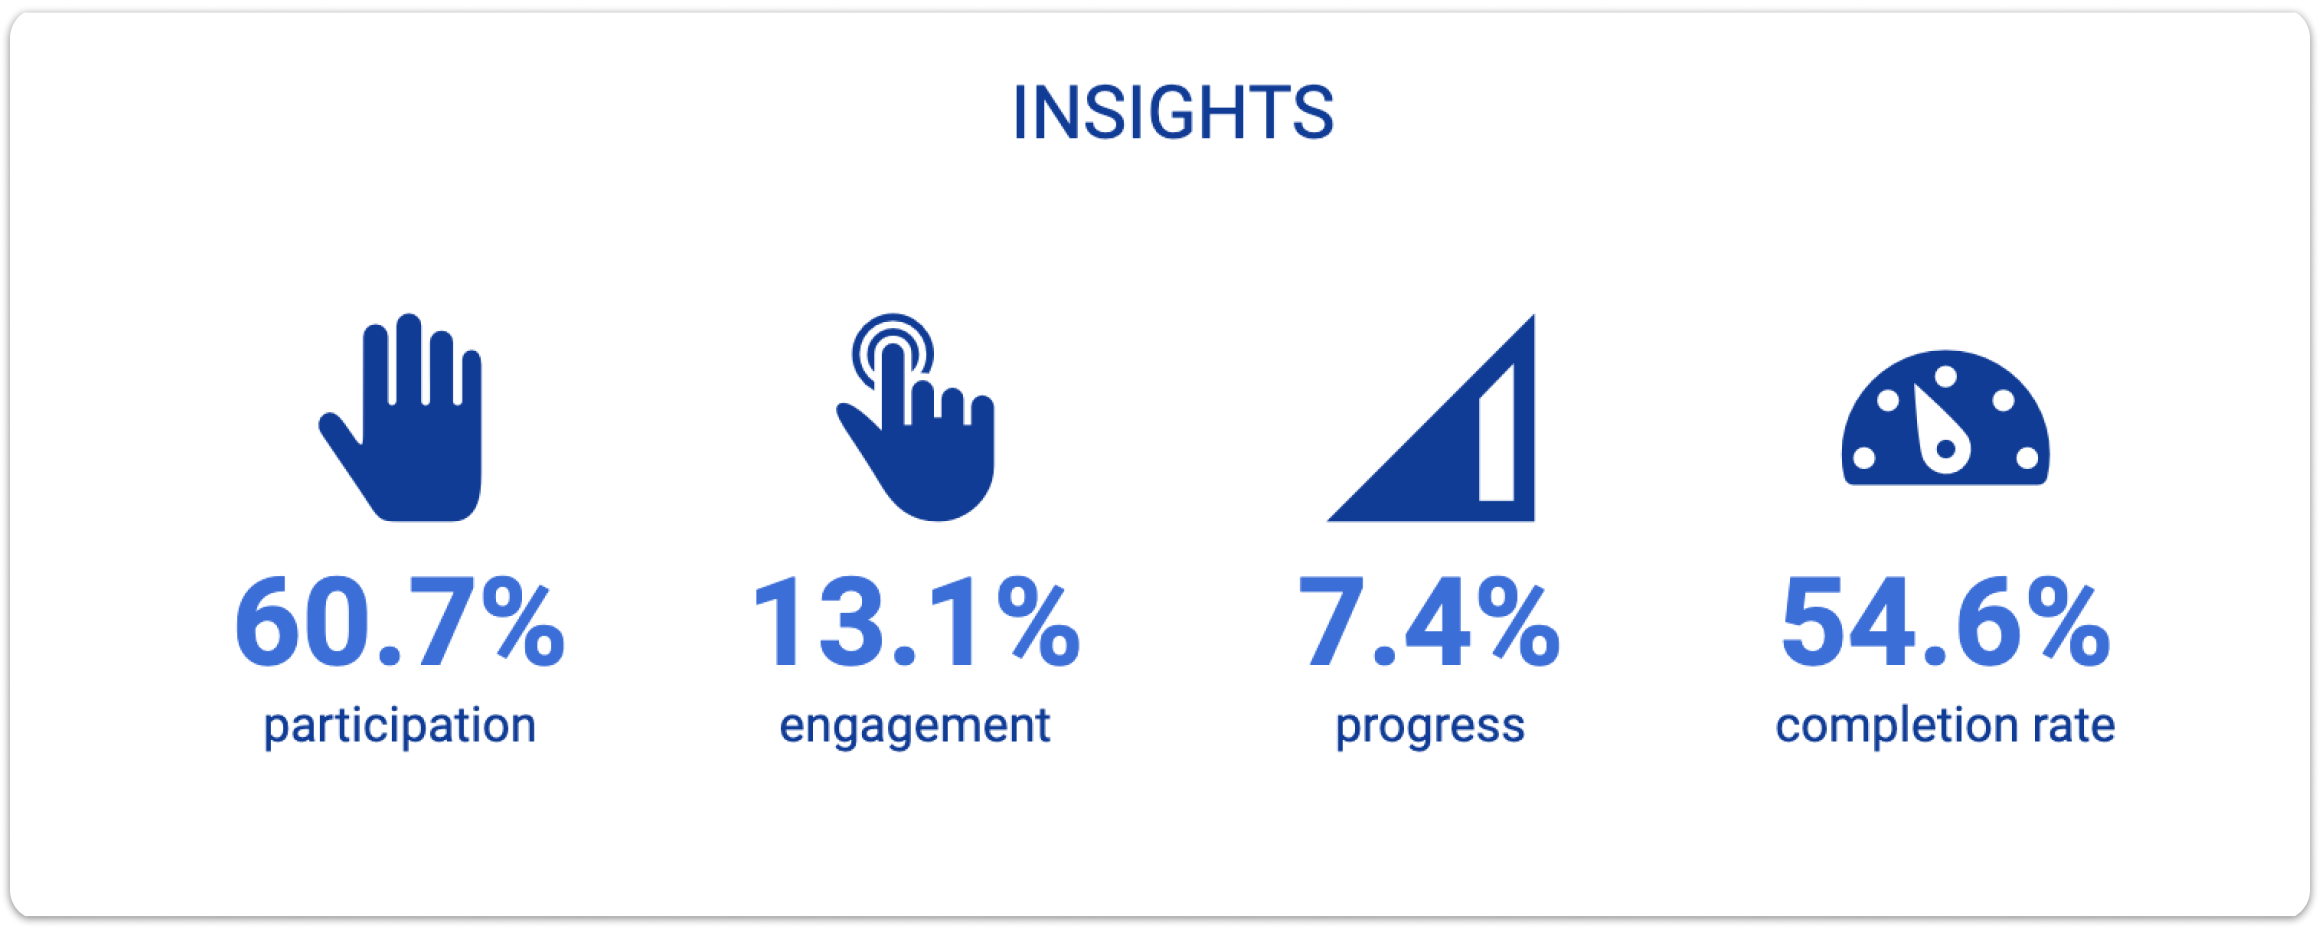
This section type displays percentages for the following available options:
- Participation: Counts active learners that are enrolled to at least one course, and compares it against the total active learner number on the system.
- Engagement: Counts active learners that have completed at least one course and compares it against the total active learner number on the system.
- Progress: Displays the average progress percentage of all active learners on every course available to them. Completed courses are counted as well.
Completion rate: Displays the average progress percentage of all active learners for every course they have completed.
Training Time
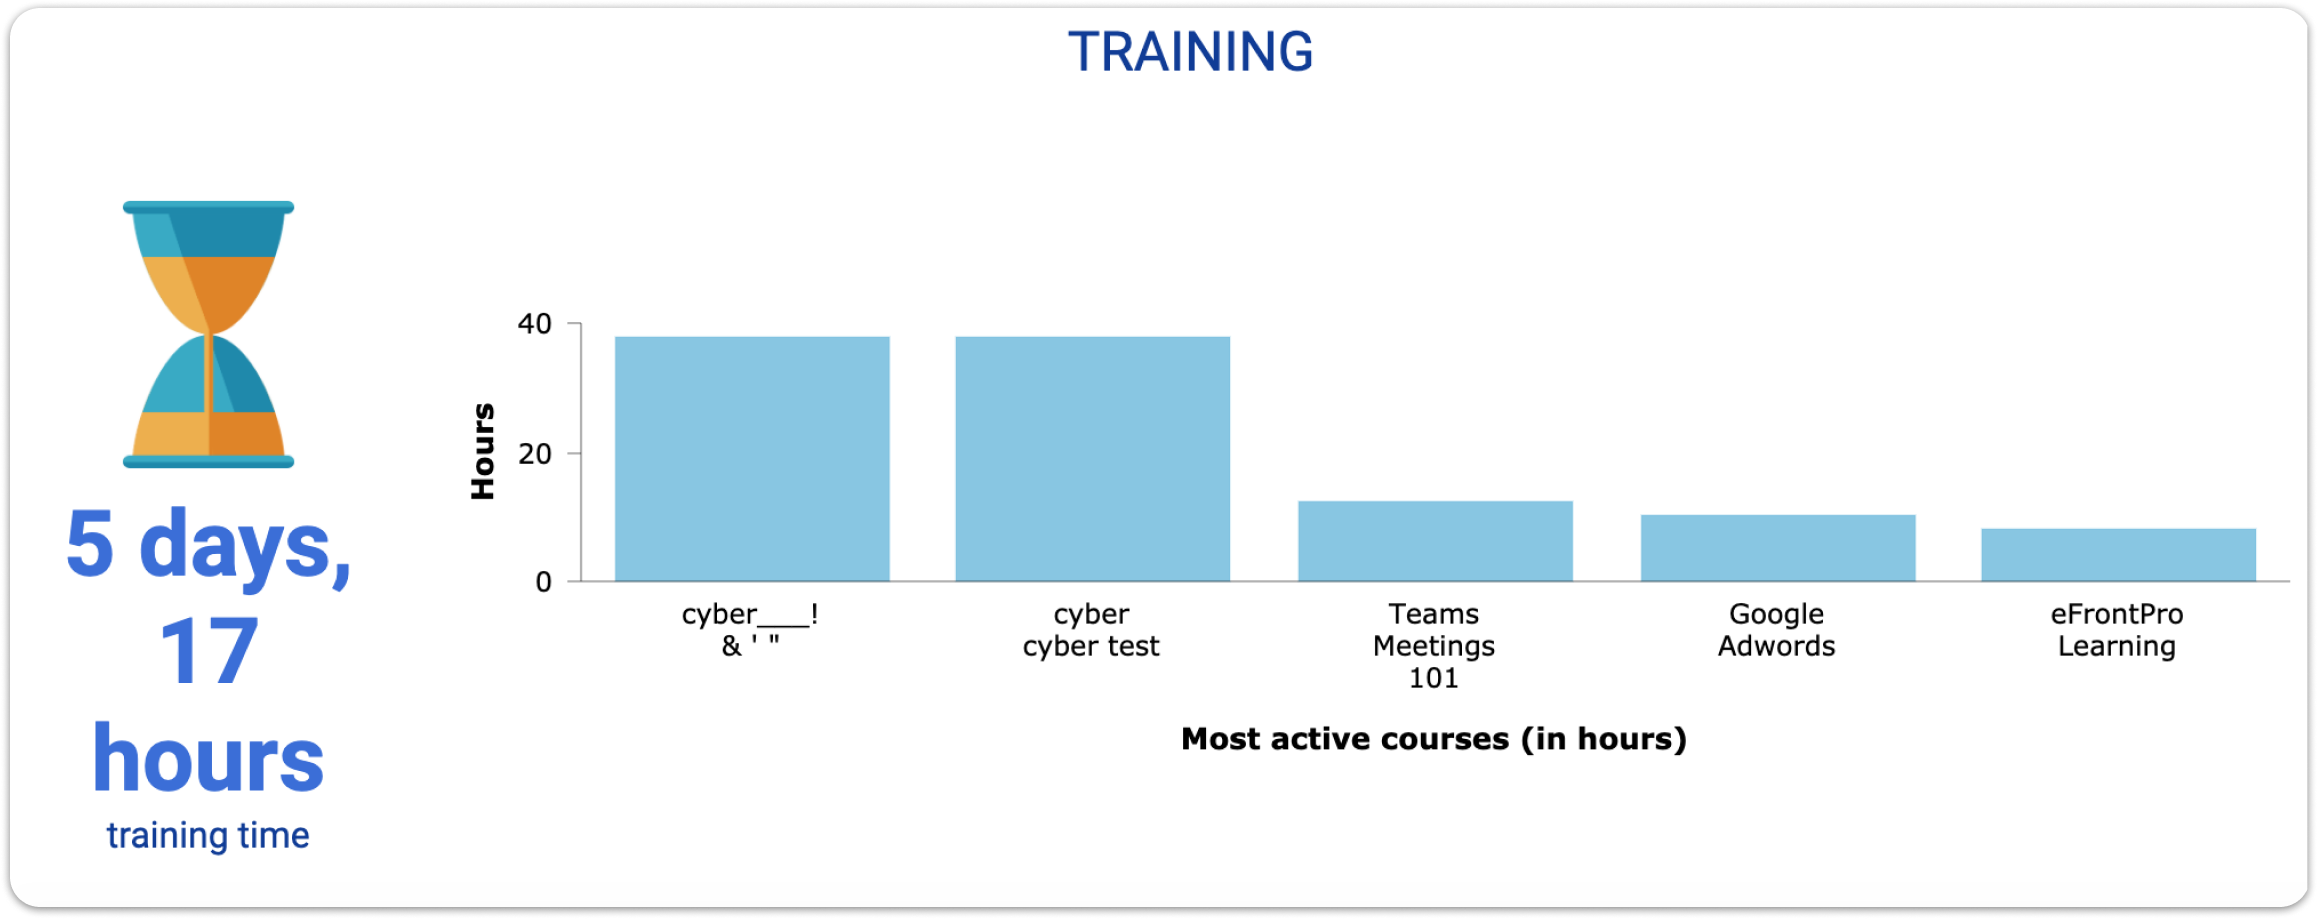
The 2 available options (and the information they provide) are:
- Training time: Total time active learners have spent on active courses.
- Chart: The 5 courses with the most time spent on them are displayed here. The time is displayed in hours.
Logins
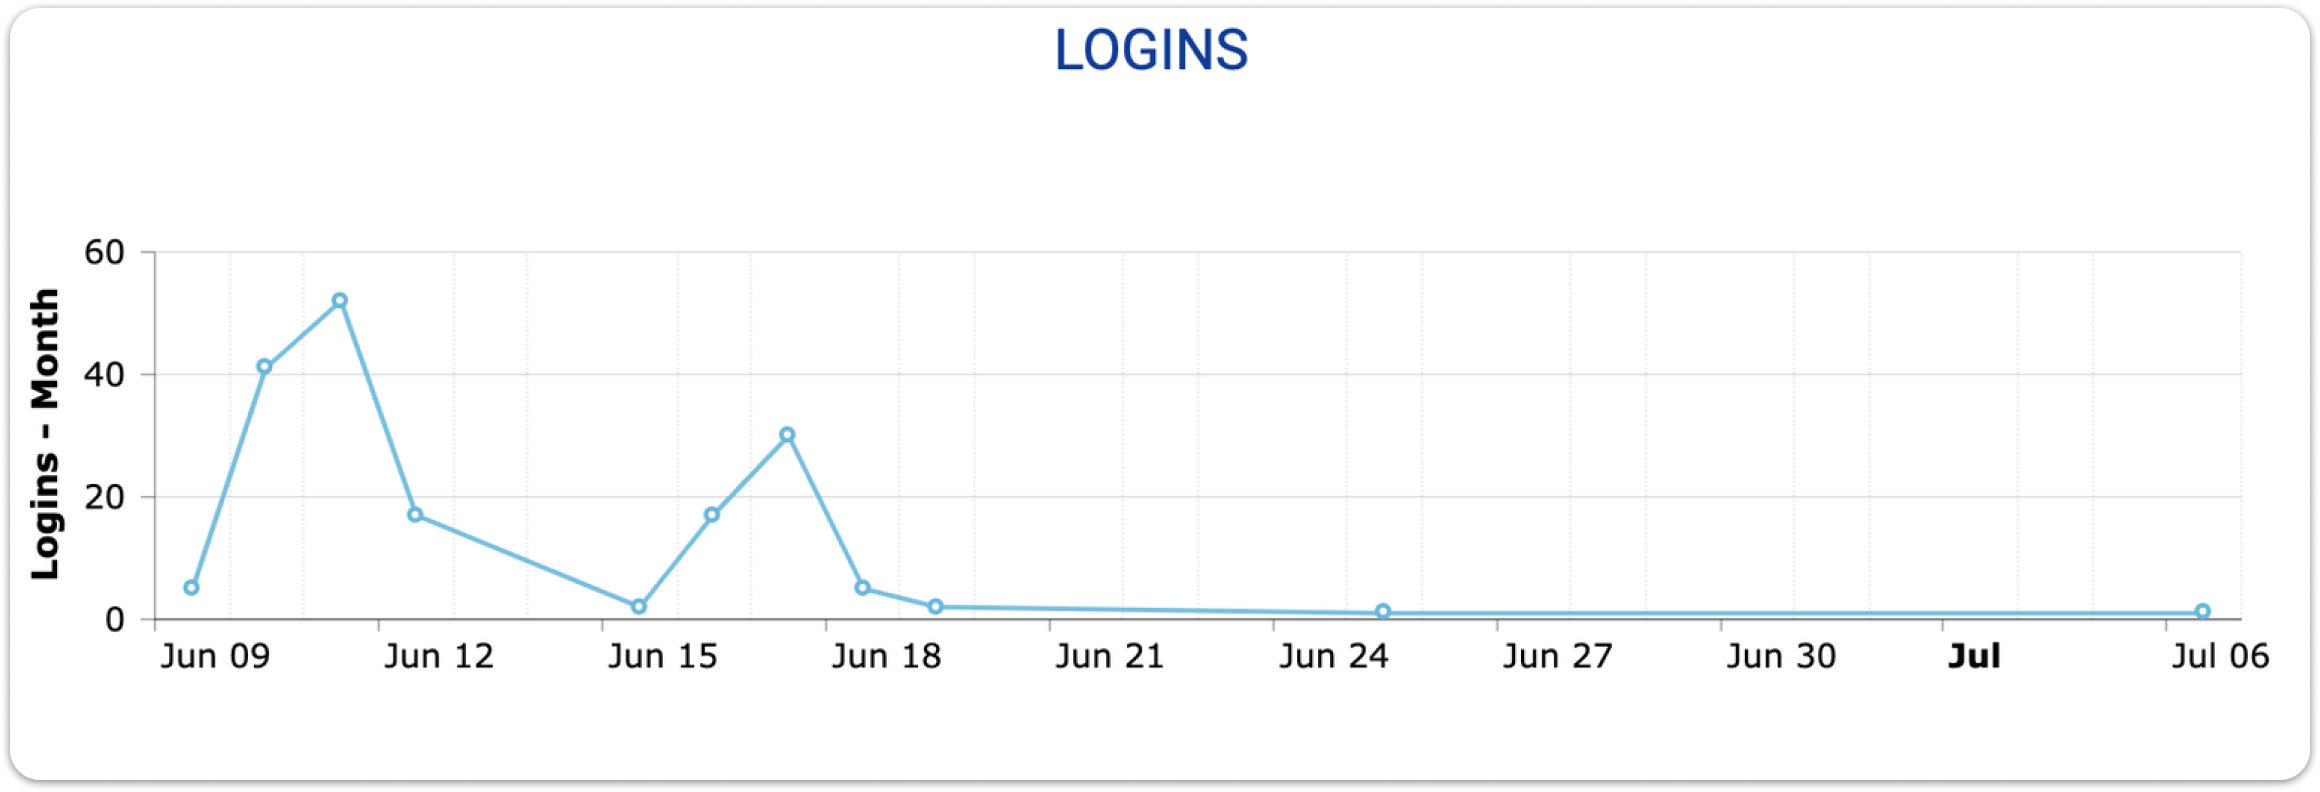
This section type displays the number of logins to the system on a given period. It has 5 available options, but only 1 can be selected at a time. The section displayed is a graph, and the available options set the time period which will be used to count the logins. The available time periods are:
- Today
- Yesterday
- Week
- Month
- Year
| Note: All options will calculate the number of logins based on the current time. For example, in the image above, we have selected the ‘Month’ period, and the current date is July 6th. This means that the starting point is June 6th and the ending one is July 6th. |
Course Completions
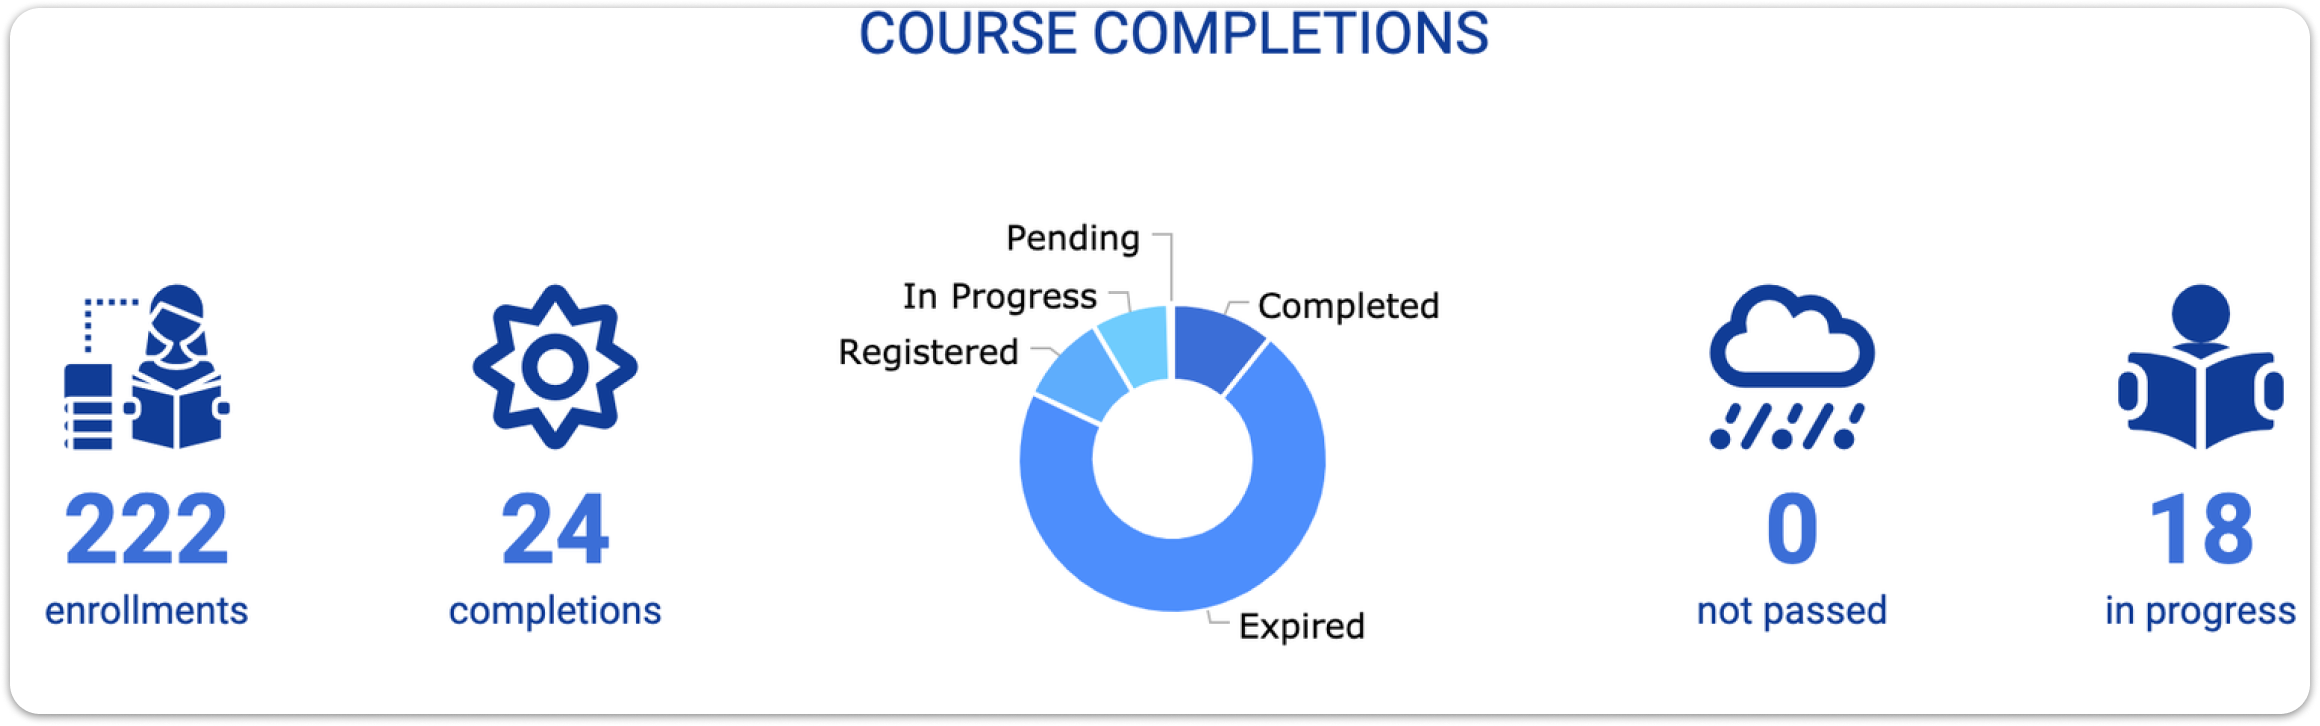
This section type presents information on course progress. The 5 available options (and the information they provide) are:
- Enrollments: How many active learners are enrolled in active courses.
- Completions: How many active learners have completed active courses.
- Chart: Displays every active user’s status on an active course.
- Not passed: How many active users have failed active courses.
- In progress: The total number of active users that have ‘in progress’ status on active courses.
Tests
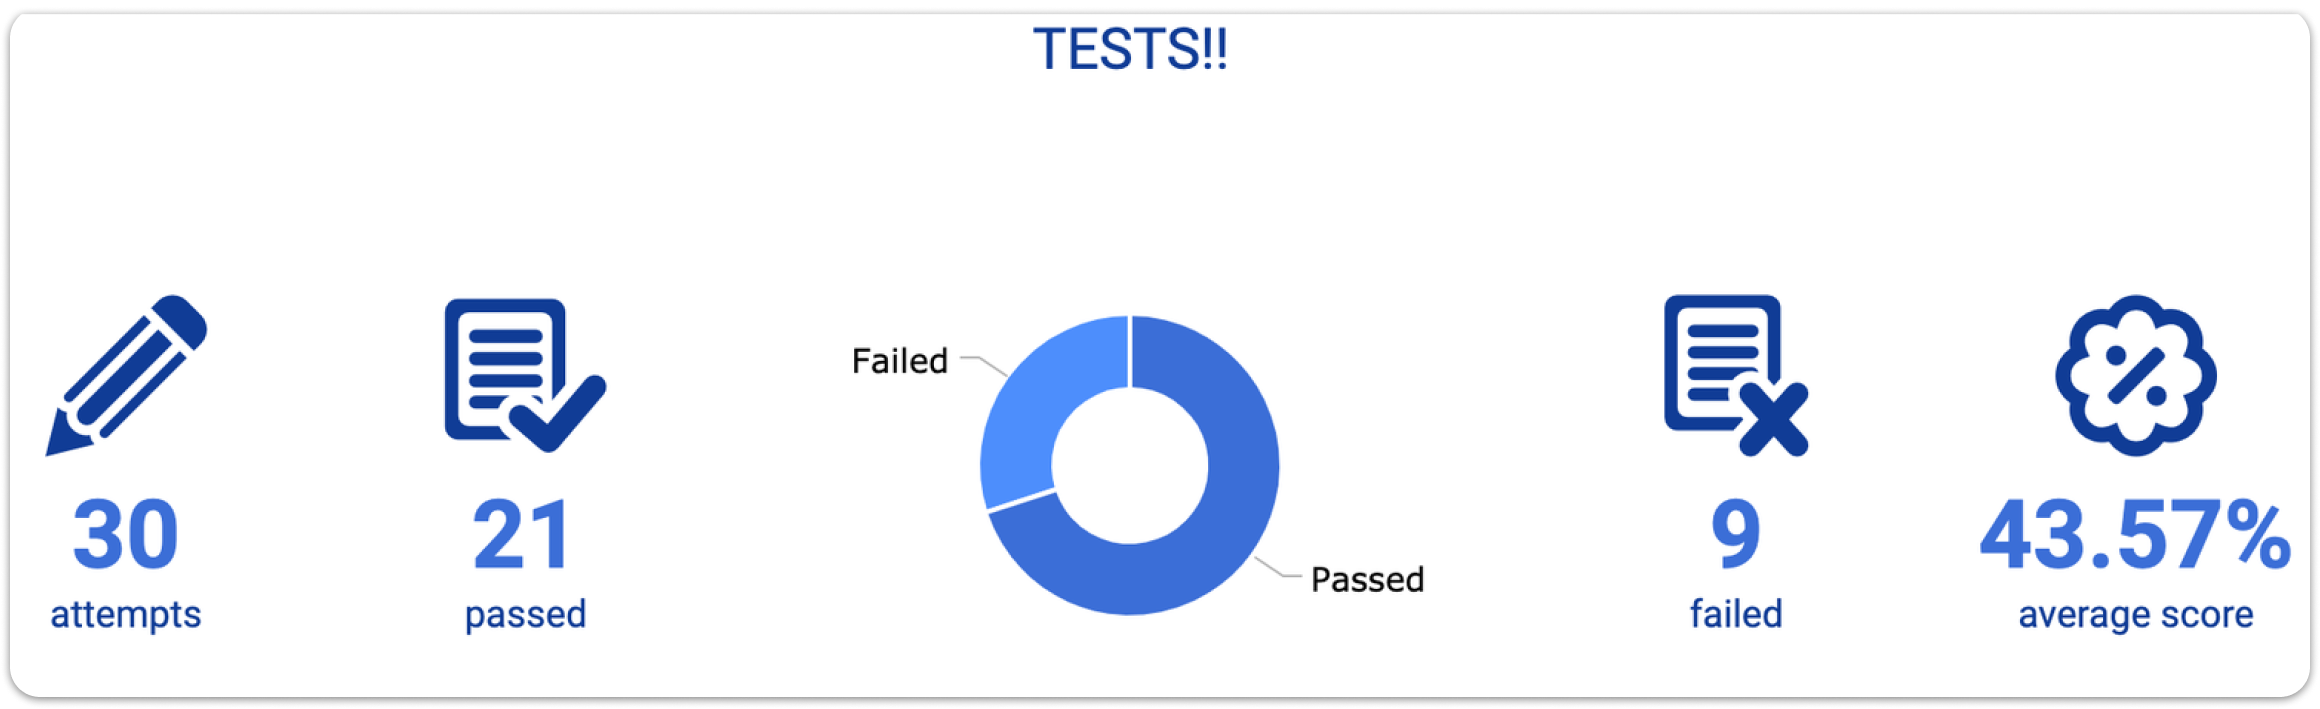
This section type presents information on the system’s active tests in active lessons. The 5 available options (and the information they provide) are:
- Attempts: The total number of attempts that active learners have made on active tests.
- Passed: The total number of passed tests.
- Chart: Displays the number of Failed/Passed tests on a chart.
- Failed: The total number of failed tests.
- Average Score: The average score of all test attempts.
Note: Self-assessment tests and skill-gap tests are not included. |
Assignments
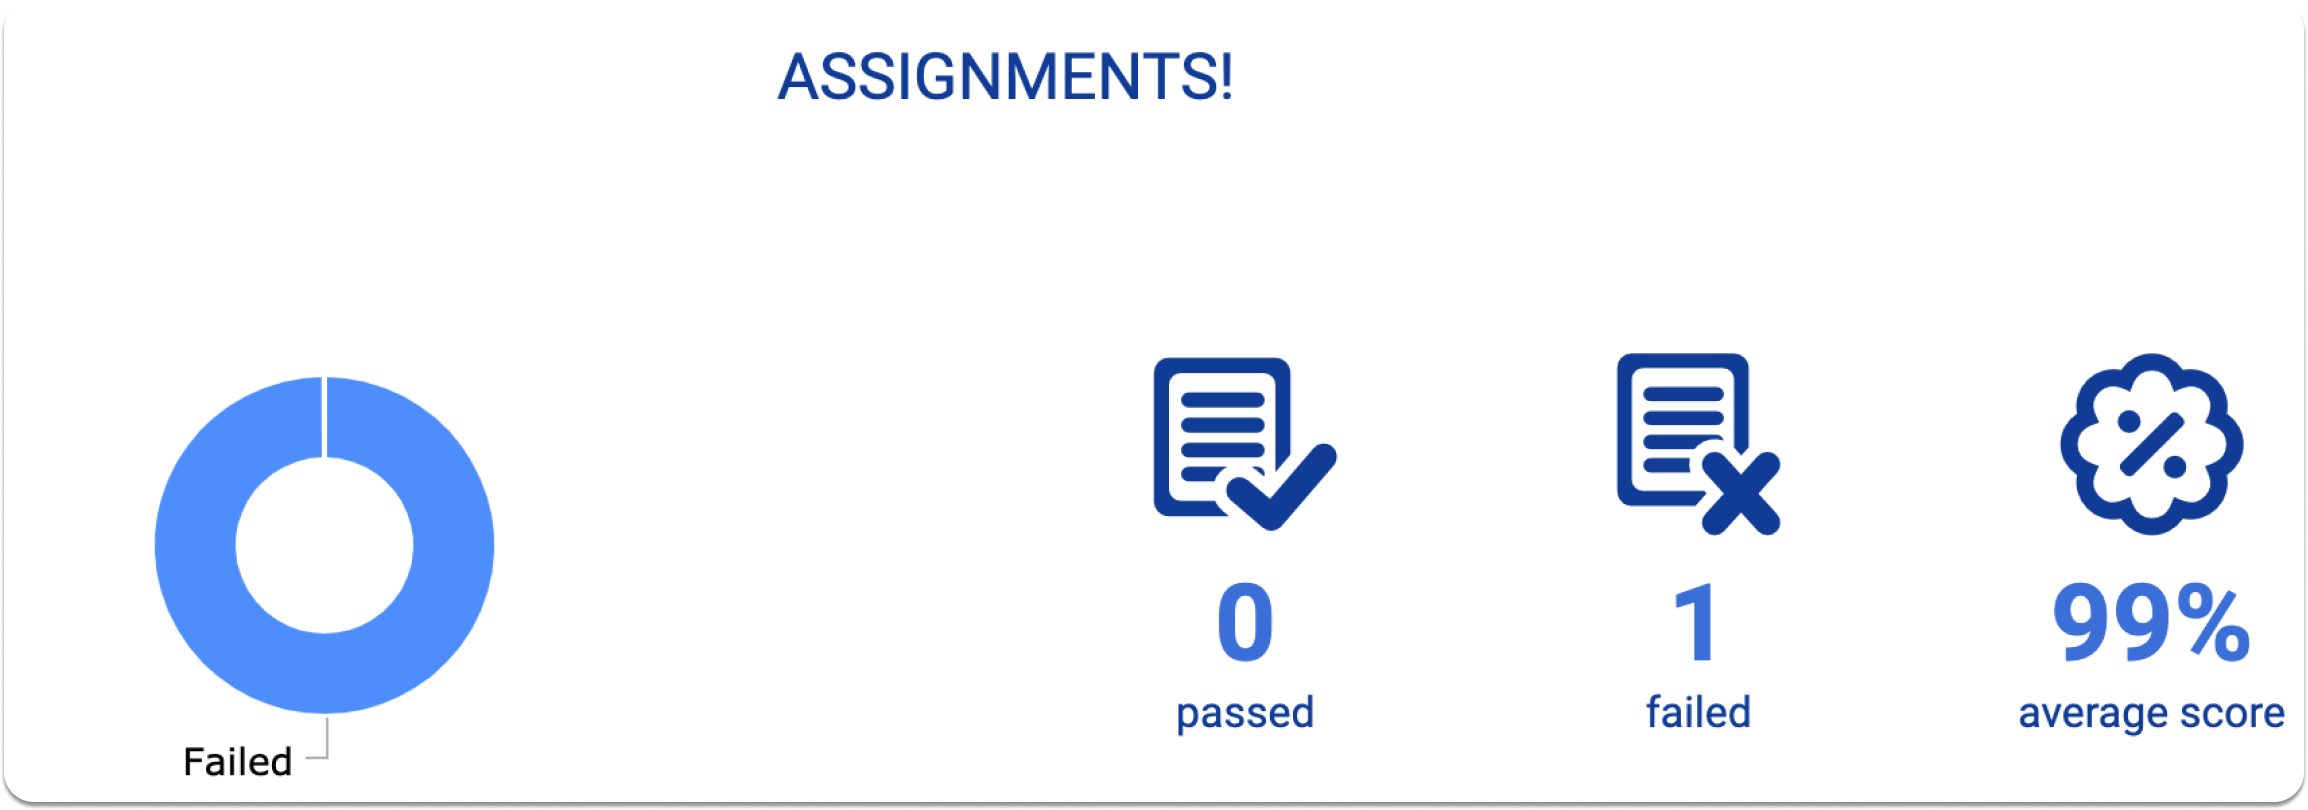
This section type displays information for the system’s active assignments. Only active learners are included. The 4 available options (and the information they provide) are:
- Chart: Displays the total number of Passed/Failed assignments of active learners.
- Passed: The total number of passed assignments.
- Failed: The total number of failed assignments.
- Average score: The average score of all active users' assignment attempts.
Gamification
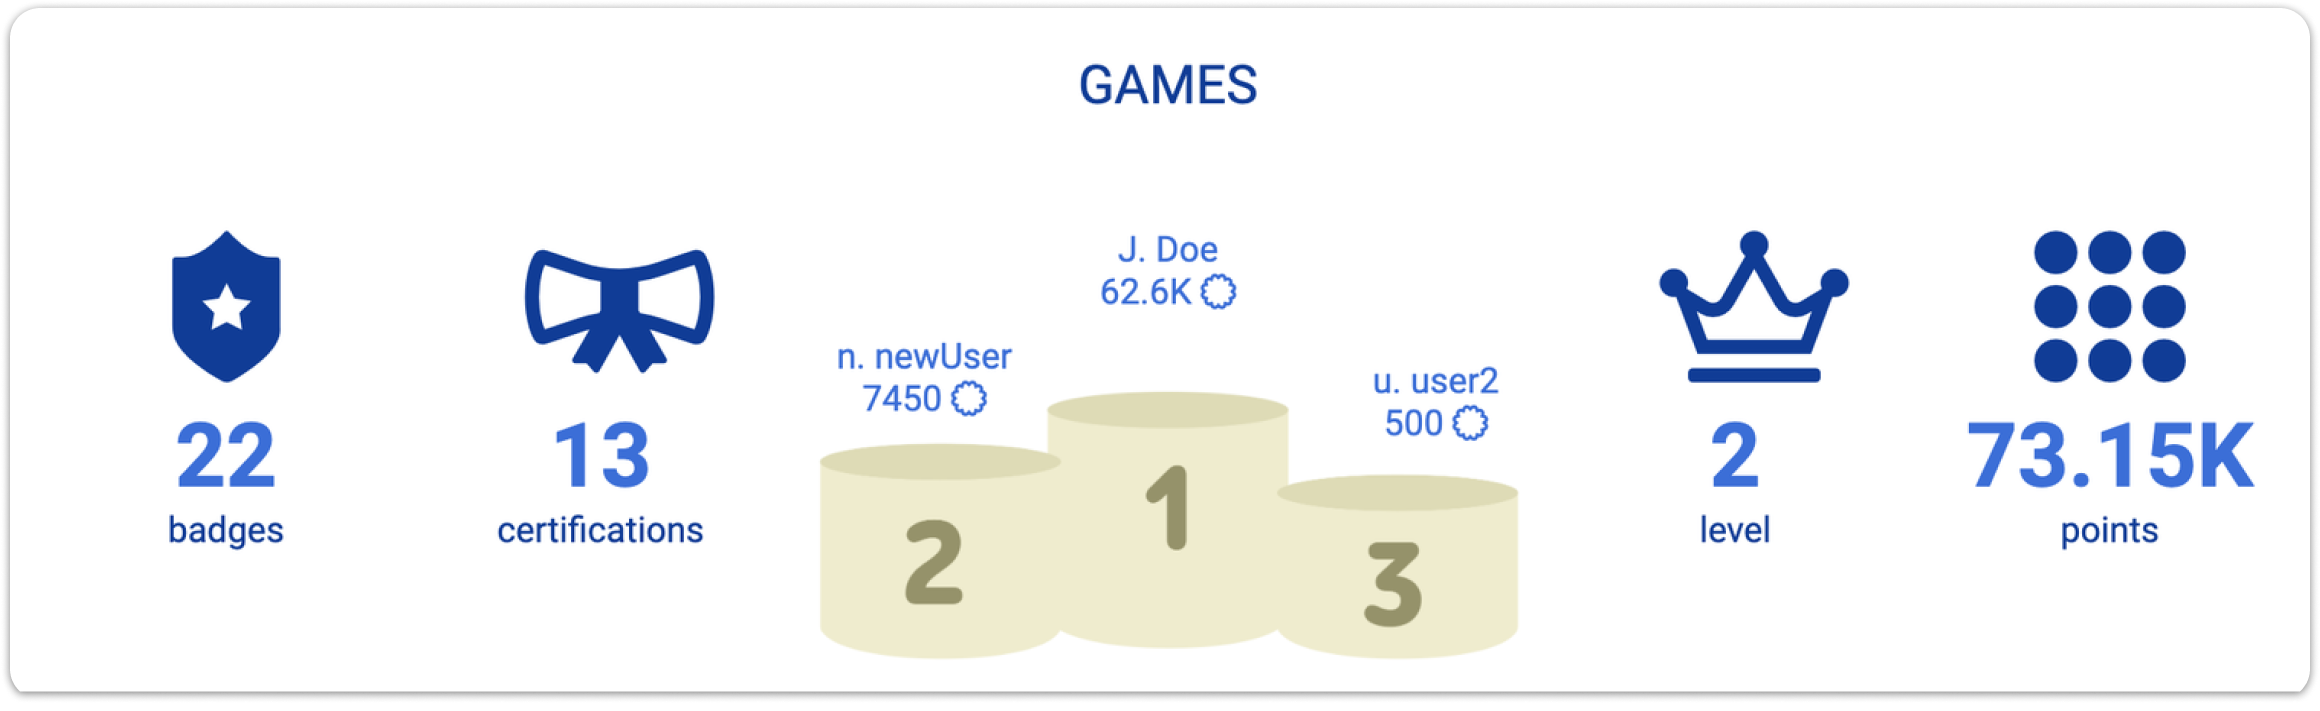
This section type shows the information on gamification data. The 5 available options (and the information they provide) are:
- Badges: The total number of badges active learners have received.
- Certifications: The total number of certifications of active learners on the system.
- Leaderboard: The top 3 (in gamification points) active learners.
- Level: The average level of active learners' gamification level.
- Points: The total number of accumulated gamification points of active learners.